This weekend, I decided to refresh my React.js skills and also try an open source tool: Kepler.gl. Kepler.gl is an open source geospatial tool for analysing large-scale data sets. This is what I ended up with: Covid19 Tracker
The integration was a bit tricky as the documentation is not very detailed. I will explain the integration in this article. But I will just be covering the Kepler.gl concepts and not the whole react development from the scratch.
Prerequisite:
- React.js
- React Redux
- Overview of Kepler.gl documentation
Installation
npm install --save kepler.gl
npm install react-palm
Preparing the data
Your data need to be in a specific format for kepler.gl. There is sample data from their documentation.
const sampleTripData = {
  fields: [
    {name: 'tpep_pickup_datetime', format: 'YYYY-M-D H:m:s', type: 'timestamp'},
    {name: 'pickup_longitude', format: '', type: 'real'},
    {name: 'pickup_latitude', format: '', type: 'real'}
  ],
  rows: [
    ['2015-01-15 19:05:39 +00:00', -73.99389648, 40.75011063],
    ['2015-01-15 19:05:39 +00:00', -73.97642517, 40.73981094],
    ['2015-01-15 19:05:40 +00:00', -73.96870422, 40.75424576]
  ]
};
Kepler.gl automatically puts your data in a layer depending on your variable names. But for that the names of your variables should be specific. Latitude and longitude being the most important ones. If they are named as lat, long, latitude, longitude, they will be identified by kepler.
Kepler.gl Reducer Initialisation
This is how my I created the state store, as mentioned on the github documentation of Kepler.gl.
import { createStore, combineReducers, applyMiddleware, compose } from 'redux';
import keplerGlReducer from 'kepler.gl/reducers';
import { taskMiddleware } from "react-palm/tasks";
function appReducer() {
    return {}
}
const initialState = {};
const reducers = combineReducers({
    keplerGl: keplerGlReducer,
    app: appReducer
});
export default createStore(
    reducers,
    initialState,
    applyMiddleware(
        taskMiddleware
    )
)
Customising the initialisation – important
There was a problem with the above initialisation. While the data was loading, it showed a pop to load data manually. And also a side panel which I didn’t want. So instead of passing the default kepler.gl reducer, I initialised it with two parameters. Setting activeSidePanel for side panel and currentModal for the pop up to null resolved that issue.
const customKeplerReducer = keplerGlReducer.initialState({
    uiState: {
        activeSidePanel: null,
        currentModal: null
    }
});
Adding data to Map
Adding data to map is simple after the kepler reducer is properly set up. Once the data is ready, you can dispatch addDataToMap action.
loadDataOnMap = (dataset) => {
        this.props.dispatch(
            addDataToMap({
                datasets: {
                    info: {
                        label: 'Data Label',
                        id: 'dataset_unique_id' //important
                    },
                    data: dataset
                },
                option: {
                    centerMap: true,
                    readOnly: true // this didn't work, so used custom reducer
                },
                config: keplerConfig // will get on to this in a minute
            })
        );
id of the dataset should be unique, this id will be used when layer is created on the map. centerMap will center your map relative to your data. readOnly was supposed to hide the side panel which I mentioned during custom initialisation of keplergl. But this flag didn’t work for me.
Kepler.gl Config
This is where most of my time was spent because of the lack of good documentation. I had to dig deeper in demo applications to understand how config is working. Only got relatively few parameters working for my app.
The kepler will load the data on a point later automatically if you parameter names are right, but that’s just it. For layer settings like radius, color, thickness, opacity and more, you will have to pass a layer config in the keplerConfig.
I couldn’t find all the parameters in the documentation. Found a config from one of their sample app, here it is: Kepler.gl Config
Apart from layer, you can customize map style and even the panel styling.
I have not been able to get all of the different config parameters to work yet. The project is still in progress. Will update this article as I go along.
I will also be uploading the project on github and will make it open to contribution if anyone’s interested.
[Update – 20 July 2020]
Here is the github repo: Covid19 Data Visualization
[Update – 22 July 2020]:
I connected to one of the lead developers of Kepler.gl to get to know about all the possible config parameters.
You can just do all the customization on map itself and then click on export like in the image below:
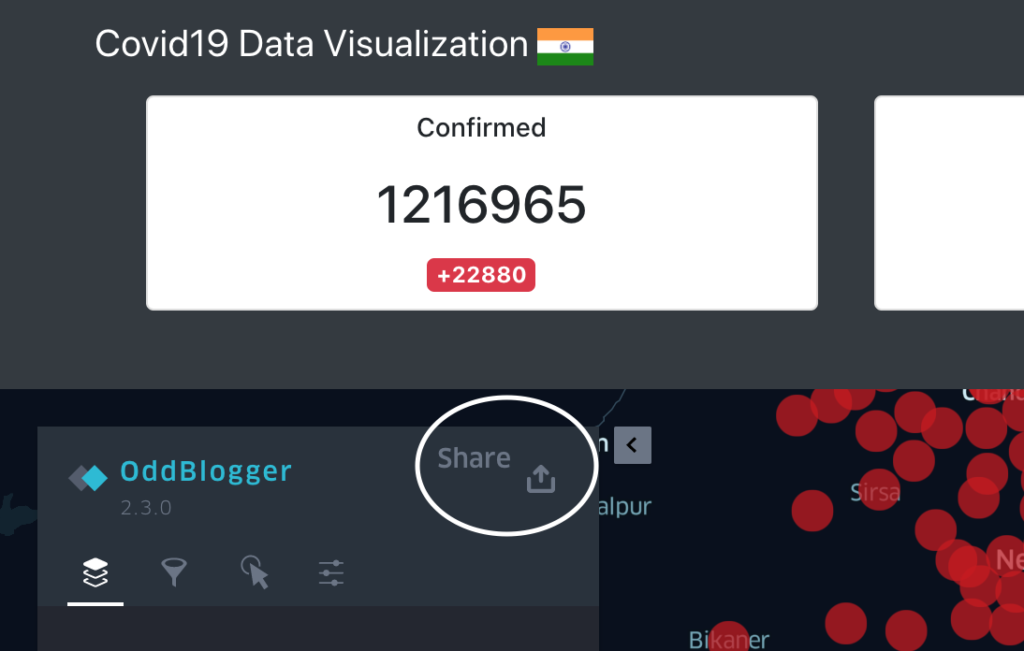
Then click on Export Map and JSON to download the json of full map. Note that the json will have other data as well, you will have to extract the layers data if that’s what you are looking for.
Also read: Coding a tinder bot with python and selenium